Visualizing the Structure by visualizing the Dependencies
Structure is the most important ingredient in any data model. One of the major contributions of Dr. Ted Codd’s relational model is the focus on the importance of functional dependencies. In fact, normalization is driven by a modeler’s desire for a relation where strict functional dependency applies across all the binary relations between the designated primary key and the fields depending on it.
As such, functional dependencies are very important contributors to the structural description of the information being modeled.
Inter-table dependencies are modeled as relationships; depending on the declarative language (e.g. SQL) they may be named (with a “constraint name”) or not.
Intra-table dependencies, on the other hand, are not present in the relational model. The only indication of their presence is the logical co-location in the table of the fields, which are guaranteed (by the data modeler) to be functionally dependent on the primary key and that alone. No arrows, no names, no nothing.
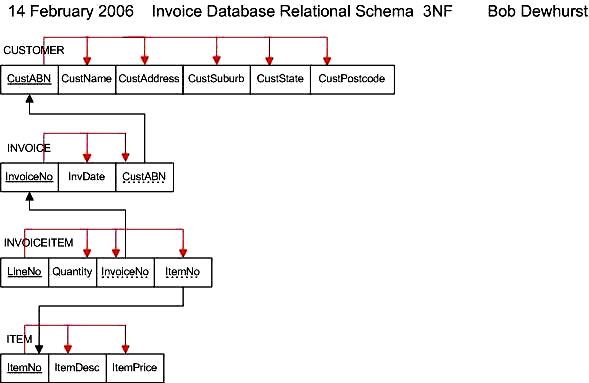
Since dependencies between data are key to creating a correct data model, we need to bring the dependencies out into the bright sun - by way of visualization. They must be clearly explicated, like the pedagogical functional dependency graph in the following diagram.
Unfortunately, not many people have worked with functional dependencies on the visual level as Bob Dewhurst (of the Charles Darwin University) does in this diagram:
As such, functional dependencies are very important contributors to the structural description of the information being modeled.
Inter-table dependencies are modeled as relationships; depending on the declarative language (e.g. SQL) they may be named (with a “constraint name”) or not.
Intra-table dependencies, on the other hand, are not present in the relational model. The only indication of their presence is the logical co-location in the table of the fields, which are guaranteed (by the data modeler) to be functionally dependent on the primary key and that alone. No arrows, no names, no nothing.
Since dependencies between data are key to creating a correct data model, we need to bring the dependencies out into the bright sun - by way of visualization. They must be clearly explicated, like the pedagogical functional dependency graph in the following diagram.
Unfortunately, not many people have worked with functional dependencies on the visual level as Bob Dewhurst (of the Charles Darwin University) does in this diagram:
What the term "relation" implies (loosely) is that the relation is a set of binary relations, and if all those relations are functionally dependent on the same function, the functional relation of all of the set members (or columns) is good to go. This relation will be stamped as properly normalized. Many people think “relationship” when they hear the term “relation.” In terms of everyday semantics, that is perfectly right.
For data modelers though, structure rules the world. And structure is not handled well, at least visually in the classic relational model.
Relationships are secondary citizens of relational. They are normally not named at all in the visualizations and functional dependencies (i.e. the sources of meaning / semantics) are not visible or named. This goes for both inter-table and intra-table dependencies.
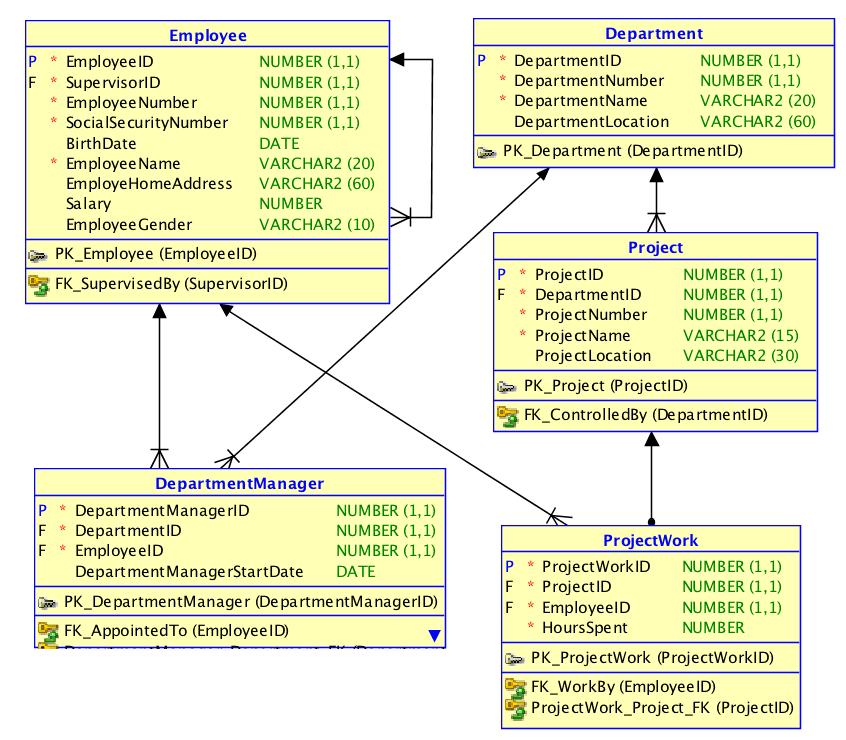
Property graphs are directed graphs, just like concept maps, and they offer elegant visualization of structure, such as this example (equivalent to the ER diagram above):
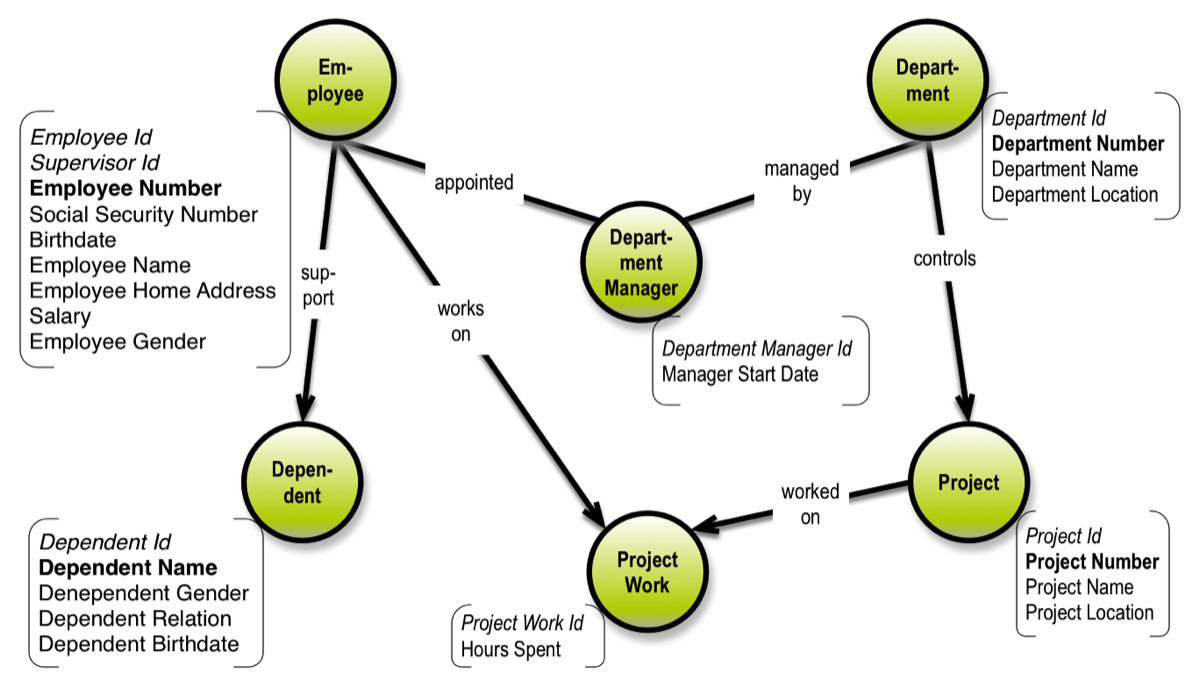
Not all of the details about the data model are found in the diagram above, but we really do not need to have all details on all diagrams, always.
Properties of a business type are all at the same “location” by definition. It logically follows that the business object types are the “landmarks” of the data model. One size does not fit all. But property graphs come close to being the perfect candidates for a database-agnostic representation of data models.
Property graphs are similar to concept models in that there is no normative style (e.g. like there is in UML). So feel free to find your own style. If you communicate well with your readers, you have accomplished the necessary.
Here is a more elaborate description of property graphs from the perspective of data modeling.
You may follow the sequence or explore the site as you wish:
You could also take a look at the book about Graph Data Modeling: